
Get Access to Indicators (Basic)
Copy indicator code and paste in pine editor in Tradingview to add your indicator.
Before using the indicator, you must optimize the signals according to your trading style.
Best Signals Sensitivity is pre-applied with default settings.
Best Timeframe for all – 1 Min, 3 Min
Try adjusting signals sensitivity to get more accurate results.
An indicator signals-based trading strategy uses technical indicators to generate buy and sell signals. These signals are based on specific conditions or criteria defined within the indicators. The strategy involves entering and exiting trades when these signals occur, aiming to profit from market movements.
Features to enable
- Smart Entry Signals
- Trend Analyzer Wave
- Order Blocks
✦ Entry Conditions
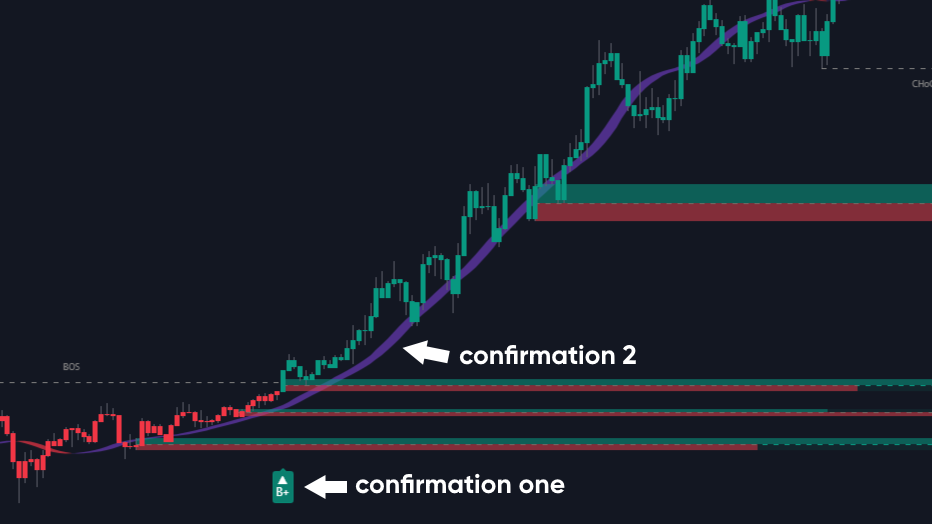
Confirmation one – Shows a BUY or SELL signal on the chart.
Confirmation two – If the BUY signal is visible on the chart, the trend wave should be blue. If the SELL signal is visible on the chart, the color of the trend wave should be red. It shows the favorable conditions to enter into the trade.
✦ Exit Conditions
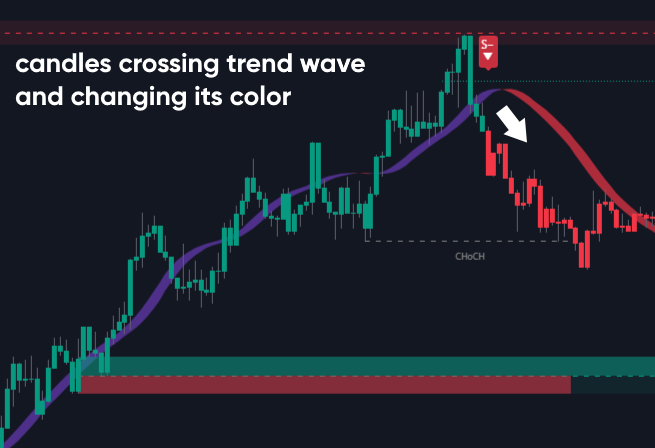
To define exit conditions for a signals-based trading setup, here are some rules.
If it is a BUY trade, the candle should be crossing the trend wave in the downward direction, and the color of the trend wave should be turned into red from blue. It shows the upcoming bearish trend of the market and the bullish position should be exited by here.
Similarly, if it is a SELL trade, the candle should be crossing the trend wave in the upward direction, and the color of the trend wave should be turned into blue from red. It shows the upcoming bullish trend of the market and the bearish position should be exited by here.
✦ Conclusion
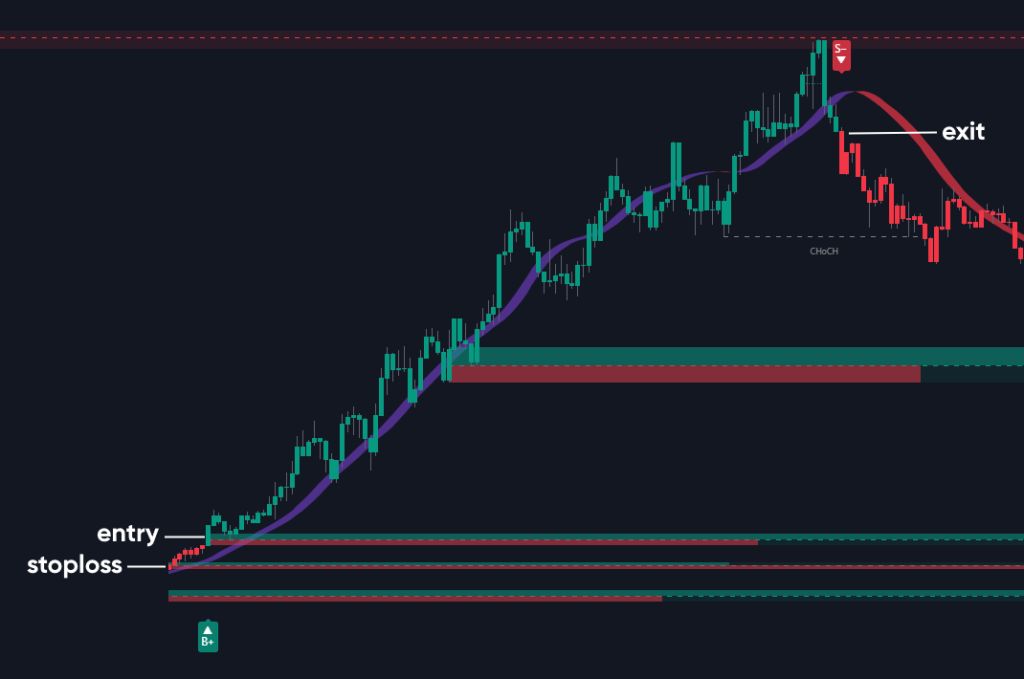
The above chart shows the entry, exit, and stop loss levels. The entry should only be taken on the candle that meets all the entry conditions mentioned in the entry rules above. To place a stop loss, the recent order block can act as a stop loss level. And, the positions could be exited on the candle that meets all the exit conditions mentioned in the exit rules.
Note: This trading setup follows the premade conditions of the UPS Premium Indicator and is not to be followed blindly. Define your risk before entering into any indicator-based trading system.
A trend-based trading strategy is an approach used by traders to capitalize on the direction and strength of market trends. The primary objective of this strategy is to identify the beginning of a trend, trade in the direction of the trend, and exit before or as the trend reverses. Here are some key elements and methods involved in a trend-based trading strategy:
Features to enable
- Smart Entry Signals
- Trend Analyzer Wave
✦ Entry Conditions
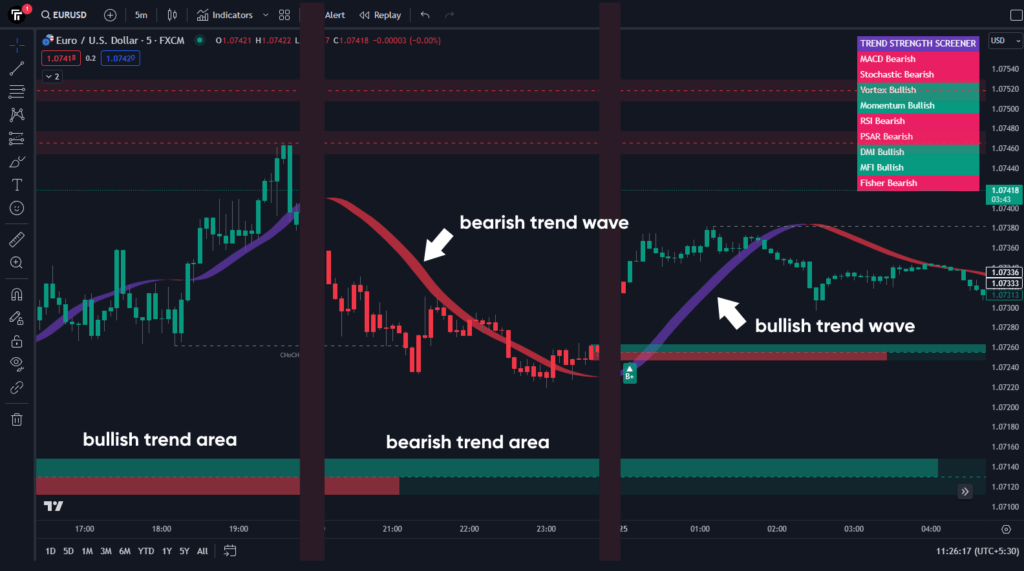
For Bullish Entries
- The first condition, the trend wave should be blue.
- The candles should be closing above the trend wave.
- The color of the candles should be green.
For Bearish Entries
- The first condition, the trend wave should be red.
- The candles should be closing below the trend wave.
- The color of the candles should be red.
If these conditions are met, fresh bullish or bearish entries can be created.
✦ Exit Conditions
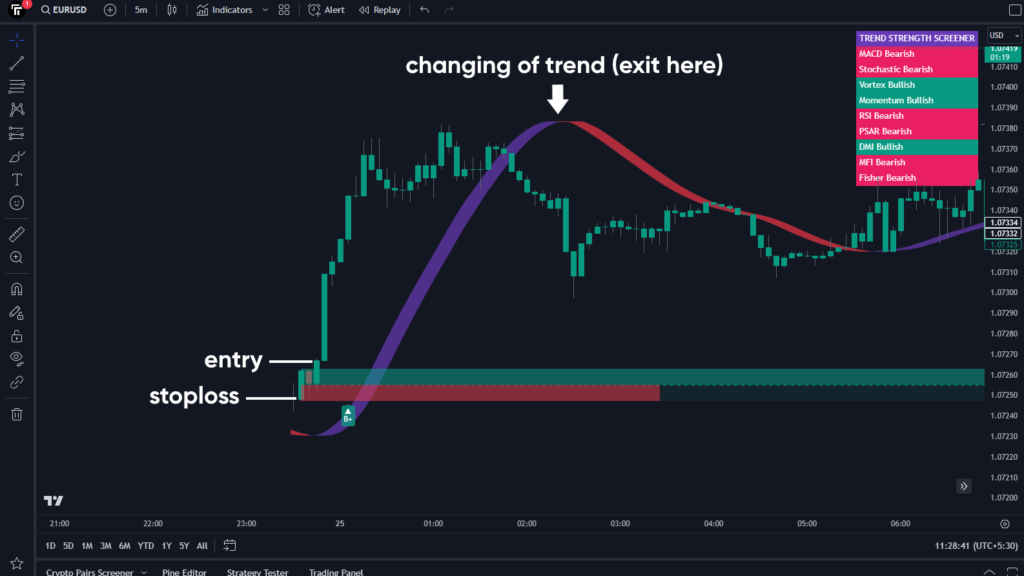
For Bullish Entries – If the candles are crossing the trend wave in the downward direction and the trend wave is turning red from blue, the bullish positions can be exited at this point.
For Bearish Entries – If the candles are crossing the trend wave in the upward direction and the trend wave is turning blue from red, the bearish positions can be exited at this point.
Rule 1. We Never Trade with our whole Capital.
Rule 2. We Utilize only 20% of our Capital.
Rule 3. If Trade hit Stoploss, we don’t take another Entry till Indicator Meets favourable Criteria again.
Rule 4. We Only Practice with Paper Trade for one Month.
NOTE: According to our experience and past market trades, strategy has accuracy of more than 90%. But make sure, we still Practice for at least a month for new stocks and indices.
Trading against the trend or in sideways markets can be a costly mistake. Understanding market trends and employing strategies that align with these trends can enhance trading success and reduce the risk of losses. Remember, patience and discipline are key virtues in the world of trading.
✦ Over 90% of traders lose money by trading with the wrong and sideways trends.
The Trend Strength Screener shows the trend’s strength on a real-time basis. With the integration of the 9 most used technical factors into one screener, this feature enables you to confirm the strength of a bullish or bearish trend as well as the sideways momentum of the market.
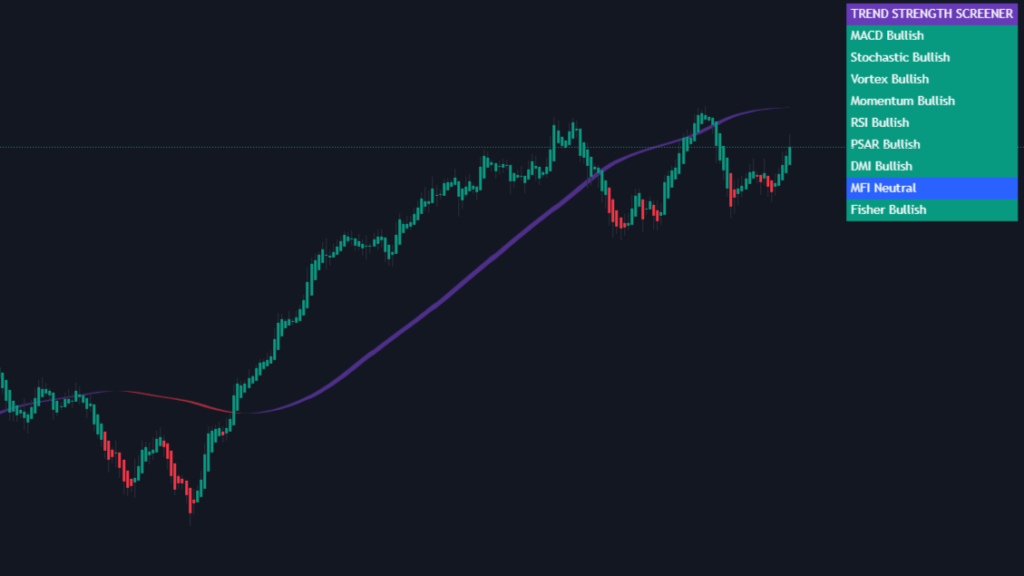
1. Strong Bullish Nature – If more than 6 components of the screener are green or bullish then it shows the strong bullish strength of the market.
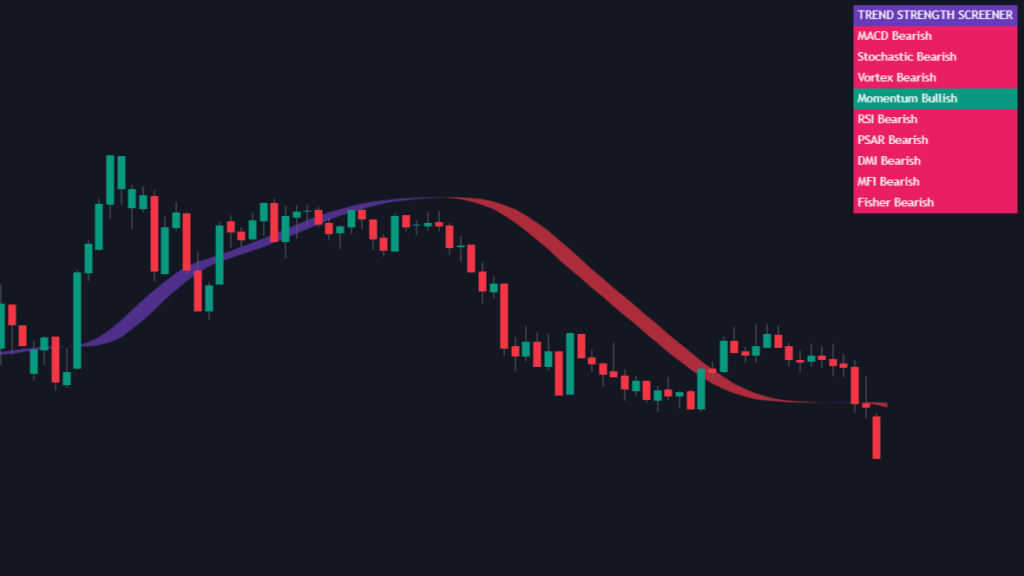
2. Strong Bearish Nature – If more than 6 components of the screener are red or bearish then it shows the strong bearish strength of the market.
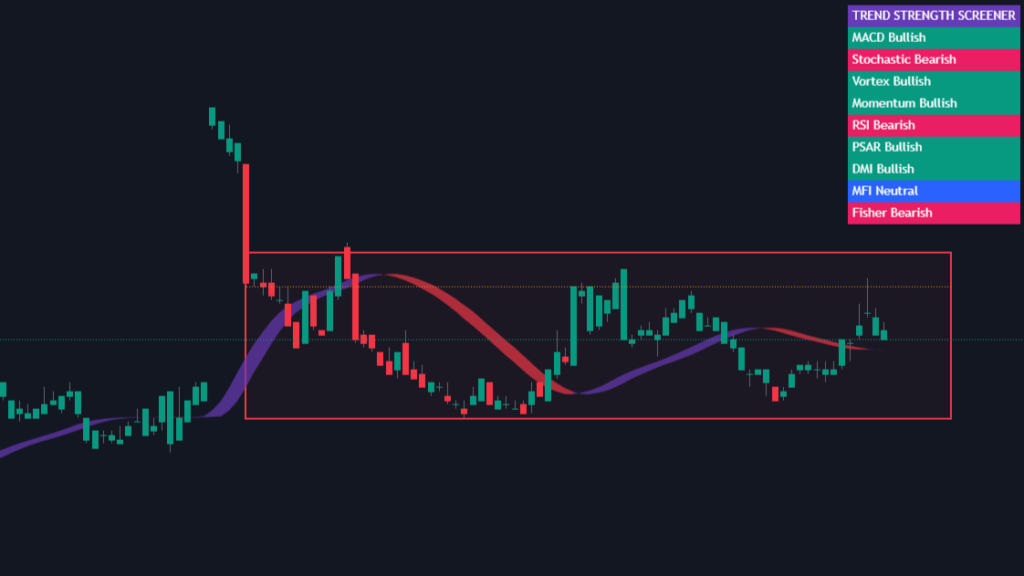
3. Sideways Nature – If all components of the screener are showing mixed colors or a neutral nature then it shows the sideways nature of the market.
Accuracy Settings (⭐ Premium Membership)

Get 5 Years Back tested Accuracy Settings
- Trading Bot for Forex and Crypto
- 100% Automated Trading Options
- Daily Live Profits Training
- Premium Community Access
- Profitable Trader Badge and Merchandise
- WhatsApp and Call Support
- Premium Discord Server
- Premium Telegram Channel
$499 ..$37 (No Loss Guarentee)

Need Help? Email now
hello@ultimateprofitsystem.in